15 Critical, But Overlooked Google Analytics Features & Functions
 Samuel Edwards
Google Analytics (coupled with Google Search Console) is one of the most powerful tools available for gaining insights about your website traffic and performance. With its wealth of features, you can gain valuable insights into how visitors are interacting with your site, from which pages they visit to where they come from and what device they use. However, there are many Google Analytics features that often go overlooked or underutilized. From event tracking to custom reports, these 15 critical yet overlooked Google Analytics functions have the potential to provide much more detailed information about your website and visitor behavior than you may be aware of. Dive in now to uncover new opportunities for optimization and growth for your own web analytics service!
Behavior Flow
You’ve probably already checked out the “Behavior” tab, where you can see how users react to different pages on your site, including how long it takes for them to bounce and where they generally enter. But the Behavior Flow section takes it to a new level. You might be intimidated by the visual component of the graph here, but if you break it down, it’s nothing that can’t be understood. In fact, it greatly assists you in visualizing the path the average user takes on your site. You can easily see which entry pages are most popular, where users go from there, and where you’re losing the most users. Use it as your guide to sculpt this “ideal” user path.
Long term metrics
When you run reports in Analytics, you probably take a look at the last month’s figures, or if you’re very committed, the last week’s. But have you looked at longer trends? Analytics can peer back as far as you’ve had the code on your site, likely giving you several years’ worth of information. Take a look at your traffic patterns between then and now—do you notice any seasonal spikes that could be taken advantage of? Did you have a dip or a substantial gain during a certain year? Have your bounce rates or conversions changed significantly? How have your Google Ads and marketing campaigns performed recently compared to historical numbers? How are your metrics looking in Google Ad Manager compared to overall organic traffic?
Audience locations
You might not think about your users’ locations, especially if you’re a national brand, but this information can be very helpful in identifying and possibly revising your target audience. Head to the Audience tab, and look at the geographic location of your users. You might find some rogue visitors from other countries that represent a possibility to expand, or you can drill down further and see what state most of your users are coming from. You can use this information to further optimize your site for those audience segments, or appeal to them in your offerings.
Experiments
Hopefully, you’re already conducting experiments in your online marketing strategy. They’re your best tools in learning more and doing better for your target audiences. However, you probably haven’t scoped out Google’s own Experiments section, which you can find under the Behavior tab. Here, you can set up basic experiments around metrics and parameters you define, offering up to 10 different variations of a single page (or target) to compare different segments of traffic against. If you’re interested in learning more or if you get stuck, Google has a great guide for this section.
Goals
If you haven’t tapped into Goals already, now’s the time to get started. It’s in your best interest to set up a goal for every significant user action on your site, whether that’s getting to a certain page from a certain page, or filling out a specific conversion form. The more you're actively collecting data on these target instances of user behavior, the more ammunition you’ll have to adjust your strategy and optimize it further. You can set up Goals in the Admin tab, then view them in the Conversions tab. The process is relatively straightforward as long as you already have specific goals in mind.
Shortcuts
Do you fumble around in your Google Analytics dashboard every month to create just the right report for your campaign? If so, you haven’t found Shortcuts yet. It’s one of the main tabs on the left-hand side, but it’s often missed by search marketers. Here, you’ll be able to store your most commonly used reports and metrics, and recall them for future iterations.
Device- and browser-based information
Found under the Audience tab, you might have overlooked the potential of learning your users’ browser and technology preferences. The Technology and Mobile menus can give you a breakdown of exactly how users are accessing your site, giving you critical insight to ensure your site’s proper functionality and possibly come up with new strategies catering to the majority of your users. For example, if you find the majority of your users are finding your site on Internet Explorer, it might be worth spending more time optimizing for Bing.
Custom Events
This feature allows users to manually track events on their website and app, which can provide insights into user behavior that might not be visible in the standard reports.
Site Search Reports
With this feature, users can understand how visitors are navigating through their website or application by seeing what they search for while browsing the site or app.
Cohort Analysis
This type of analysis gives the user an idea of how different cohorts (groups) of customers behave differently over time based on certain behaviors like purchase frequency or engagement rate.
Real-Time Reports
These types of reports allow you to view information about active users from your Google Analytics account as well as measure performance against goals set in real-time so that changes can be made quickly if needed.
Multi-Channel Funnels
Users may use multiple channels during a single session when visiting a website or using an app, such as direct traffic, organic search results and referrals from other websites – multi-channel marketing funnels help you identify which ones bring the most value with regard to conversions and sales generated from each channel used during that session .
Benchmarking/Comparisons
Comparing data within Google Analytics helps you better understand performance trends relative to other websites and apps. With this feature, users can see how their website or application stacks up against industry averages and make adjustments to improve performance if necessary.
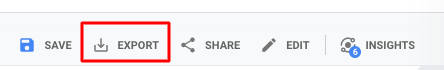
Data Export
This feature gives users the ability to export analytics data from Google Analytics into a variety of formats, such as CSV, PDF, etc. This allows them to analyze the data further in programs like Excel and Tableau or use it to create custom reports for stakeholders.
Alerts
Google Analytics allows users to set up alerts when certain metrics exceed a certain threshold, giving them the ability to take action quickly if needed. This helps keep them informed of key changes and progress related to their website or application. Google Analytics is an incredibly powerful tool for marketers and business owners to gain insights into their customers’ behavior. With the wide range of features such as custom dashboards, custom events, site search reports, cohort analysis, real-time reports, multi channel funnels, benchmarking/comparisons data export and alerts – users can quickly understand how visitors are navigating through their website or application and take action if needed in order to improve performance. By leveraging Google Analytics effectively with these tools at your disposal you will be able to make informed decisions that drive more traffic and sales.