Content Marketing: Using Content & SEO to Grow Your Business [Complete Guide]
 Timothy Carter
![Content Marketing: Using Content & SEO to Grow Your Business [Complete Guide]](https://pub-37f59721e1f04a11808be30d34c79c16.r2.dev/f/292688405422985/20888/005d039dc1/content-marketing-an-seos-guide-to-creating-and-promoting-digital-content.webp)
Defined simply, content marketing is: 1. The Creation of Quality Content 2. The Promotion of Quality Content
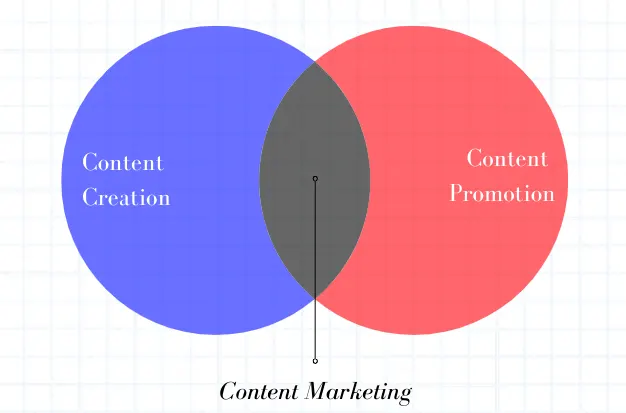
In this, step-by-step,all-in-one guide to planning and launching a content marketing strategy you will learn that good content marketing strategy includes both on and off-site content creation and on and off-site content promotion. And they're almost never mutually exclusive. For instance, video content marketing for Youtube would fit into both the created and promoted buckets. You might create a quality blog post and then promote it by PR and link building outreach, then create more content off-site to link back to your original post. In reality, content marketing may more appropriately look like this:

The who, what, when, where why and how you create and promote your content is how one develops the ideal content marketing strategy for success.
In order to create and promote, you need to understand your ideal customer persona, where they are online and how to promote to them. In other words, you will need to have the necessary skills to be an adept content marketer. Only then will you gain a true edge or competitive advantage. For instance, a Shopify ecommerce store will have a very different creation and promotion strategy than a local tax attorney or tax service business.
How to Plan Your Content Marketing Strategy
There are some important reasons why you should plan a content strategy—by which I mean a formally written document—that outlines your plans for success. According to research from the Content Marketing Institute, there are four main factors responsible for differentiating self-described “successful” content marketers from self-described “unsuccessful” content marketers.
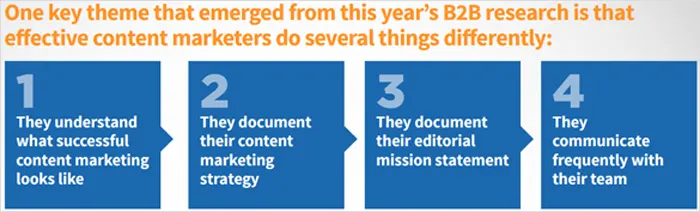
(Image Source: Content Marketing Institute)
The Content "Research Phase"
Let’s move on to the actual steps you’ll need to take to draft your content strategy. First, you’re going to need raw information. Remember what I said about needing to have more objective information, rather than relying on your own assumptions and instincts? This is the stage of the process you’ll use to get that information. There are several types of research you’ll need to perform, each with their own challenges and tactics. Your end goal is to walk away with enough raw material and data to inform your strategic decisions. When doing content marketing research, you can use keyword research tools or the unique data provided from organizations like Content Marketing Institute. Let’s take a look at some of the most important research areas:
Market research
Market research is what you’ll use to identify and understand your target audience. Your target audience will be the ones reading your content, supporting it through social sharing, and eventually becoming customers. Hopefully, you already have a solid idea of who your clearly defined audience is—but don’t make assumptions yet. Take your time evaluating different demographics and how they might relate to your brand and already have brand awareness based on your content marketing. There are several ways you can do this; for example, you can rely on government-drawn census data to learn more about the buying habits and dispositions of your key demographics (and demographics you may not have previously considered), or you can leverage recent industry studies or market research companies to dig deeper into more specific information. Google Trends and Content Marketing Institute are great tools for engaging in custom research on trending keywords as well as research insight from articles on the company website.
Device usage
You’ll also need to pay attention to what types of devices your target audience is going to be using. For the most part, you’ll find that there’s a great diversity here. More users are opting for multi-platform access to content, switching between desktop devices, tablets, and smartphones throughout the day.
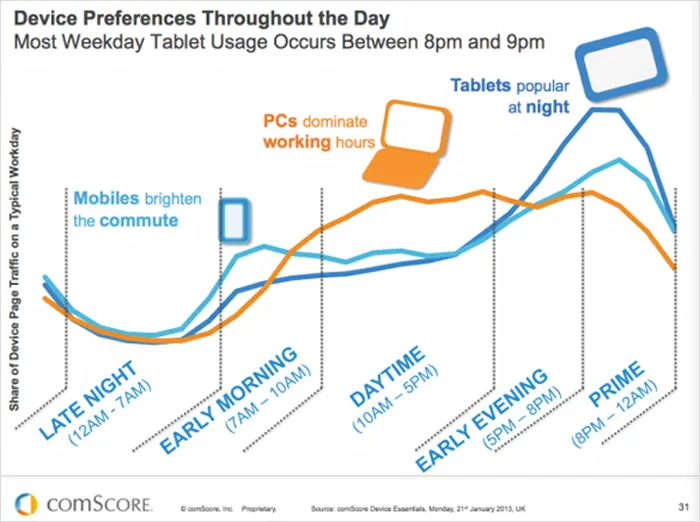
Image Source: ComScore (via smartinsights.com)
Still, you’ll find that your demographics and your industry likely favor one device more than the others. You’ll need to make your content compatible with all devices, but you might bear one in mind more than the others.
Preferred media types
Don’t neglect things like images, videos, and audio streams. Beyond that, there are multiple methods of serving these mediums, such as various channels and file types, and many formatting variables, such as length and overall presentation. Most content marketing strategies will benefit from using multiple of these media types simultaneously, but the only way to figure out which ones are best for you (and your audience) is to research it.
Competitive research
Competitive research adds another layer of sophistication to your research phase. So far, you’ve been researching what audience segments you’ll be focusing on and what types of content they might like to see. This is good information, but it’s all theoretical. Competitive research helps you see content marketing in a live environment—and in your niche, no less. Make a list of your direct and indirect competitors, and take a look at what they’re doing for their own content marketing campaigns.
Keyword research
Keyword research is specifically done for SEO, though even if you don’t plan on investing heavily in an independent SEO campaign, it’s worth doing. Here, your goal is to uncover various keywords and keyword phrases that might serve as good targets for content topics.
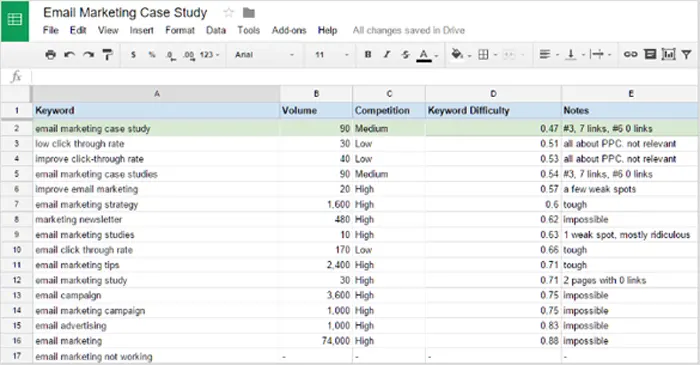
(Image Source: ahrefs)
Again, keep any keyword insights you find here in balance; your primary goal is to produce good content. Write for readers, not for search engines.
Setting Content Marketing Goals & Establishing a Timeline
Once you’ve done enough research to give you a broad understanding of your clearly defined audience, your competitive position, and your niche, you can start drawing up the main goals of your campaign—as well as a timeline in which you’ll meet those goals.
The long-term nature of content marketing
Before you get too ambitious, you need to realize the long-term nature of content marketing. You can’t use content marketing as a get-rich-quick scheme, nor can you use it as a short-term boost for your brand awareness. If you’re going to get involved with content, you need to have a long-term focus.
Budgetary considerations
Ideally, you’d have plenty of resources with which to fund and grow your content campaign. It’s technically possible to start a campaign with no upfront investment; you can start a blog for free, spend your own time to do your research and draft your strategy, and spend your free time producing content to get you started. However, as you scale, you’ll likely find yourself in need of more resources, and don’t forget—time is money. Every minute you spend doing something that’s not something only you can do is value lost to your business. Additionally, there’s a correlation between the amount of time and money you invest and the results you’ll see.
Types of goals to set (traffic, conversions, etc.)
When it comes to setting goals, you’re going to have to consider a number of different areas. Merely stating that you want to “increase brand awareness” or “earn more revenue” isn’t enough. You’ll need to drill down to individual dimensions of performance. You can decide these for yourself, but there are a handful most will want to keep as high priorities:
Website Traffic
Traffic can come from a number of different areas; organic traffic involves traffic coming from search engines, referral traffic is traffic from outside sources, and social traffic is traffic from social media syndication. All three stem from the quality of your content, and all three types of traffic can drive more revenue to your site through sheer volume. If you already have a solid conversion rate, this should be a top priority.
Customer (and Potential Customer) Engagement
Engagement comes in many forms, and once again, you’ll need to consider which forms are most appropriate and most impactful for your business. The simplest definition of “engagement” is a user’s direct interaction with your brand. It could be a comment on your article, a subscription to your newsletter, or even a follow-on social media. Engagement serves as both an indication of content success and a driver of value (since it brings a user closer to your brand) and is perfect for encouraging brand awareness and authority.
Website Conversions
Traffic and engagements are nice, but conversions are the real goal. If you aren’t concerned about the amount of traffic you’re getting, or if your hardline desire is strictly focused on getting more immediate revenue, conversions should be your main focus.
Content Marketing Brand Considerations
After you’ve set your goals, you can start working on how you’re going to execute your content marketing campaign. One of the most important considerations you’ll need to bear in mind are those related to the brand (or brands) you plan to use and how you can align your content marketing efforts with your brand.
Building brand awareness
There are some benefits of content marketing that exist in isolation, but the majority are directly tied to your brand’s consistency—how visible, recognizable, and familiar your brand is at every point of engagement. This is what will build familiarity among your target audience.
Personal brands
Corporate brands aren’t the only type of brand you can use in your content marketing. In fact, personal brands (as a substitute for or extension of your core brand and content marketing campaign) can be quite powerful. The idea here is that corporate distrust is at an all-time high; people see companies as unreliable, manipulative, and impersonal—and that trend can affect your business’s brand, too. Personal brands adhere to a set of characteristics and values, consistently across multiple channels to build a reputation.
Brand voice
Regardless of which brands you choose to use, the main conduit for your brand’s consistency in content is going to be your voice. Your tone and your style (in writing as well as visual mediums) is going to be your signature.
Targeting a Market
Now, you’ve already come up with a target market, and you have a general idea what that target market likes and dislikes, and what their values are. Now it’s time to formalize this information in the context of your content strategy. The best way to do this is with a customer persona (or multiple personas, if you have multiple demographics). This persona is essentially a fictional character you’ll be creating as the “average” customer you want to target. To start, come up with a list of traits that define your average customer, whether those are demographic (age, sex, geographic location), environmental (family, education, career), or behavioral (disposition, buying habits, typical brand relationships). Then, put a name and a face to that description. This will help you solidify the way you think about your target audience, and think about it in a more human, approachable way. Once defined, you’ll be able to picture this persona in your mind when writing content or hiring a content writing service, helping you to write specifically for this given audience.
Types of Content Marketing
I’ve mentioned content types conceptually, but it’s time to define exactly how these will function in your content marketing campaign. Some of the key content marketing dimensions you’ll need to consider are:
Content Marketing Mediums
There are tons of ways to create “good” content. You’ll need to consider written content, images, infographics, gifs, videos, audio content, and everything in between. Each of these mediums has different advantages and disadvantages for various target audiences, though in most cases, a blend of different choices will give you an edge.
Content Formats
How your format your content also plays a role in how engaging it is, and how well it fits with how you are working to build brand awareness. For example, short-form posts are faster reads and are more shareable, but long-form posts are more authoritative and useful (as general rules).
Content Archetypes
There’s no limit to the type of subjects you can choose for your work, but most content can be categorized in terms of archetypes, such as “how-to” posts, tutorials, listicles, opinion pieces, news, and so on. Use your competitive and market research to uncover which of these might work best for your brand and try using them all to measure their effects. The other big variable to consider, of course, is volume. How many of each type of content are you going to produce, and how often will you do it? With this information, you’ll be able to set up a rough editorial calendar, the last piece of the puzzle you’ll need before you actually start executing on your strategy. Your editorial calendar doesn’t need to be anything fancy—at least not at first. It can be a common spreadsheet with listings for your content title, medium, format, and publishing information.
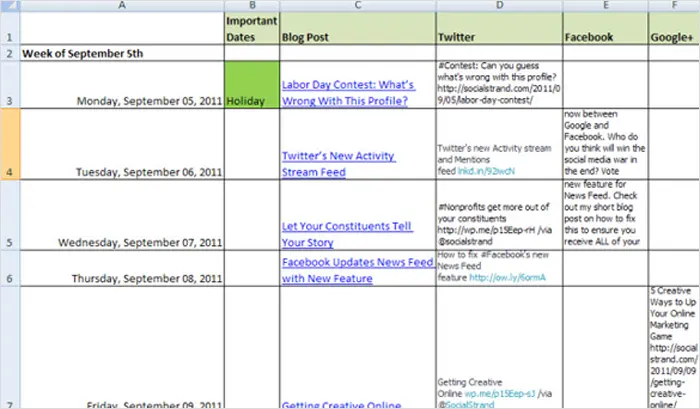
(Image Source: Georgetown)
Content Marketing Distribution & Syndication
The final stage of your content strategy is distribution. Content generally isn’t seen unless you do some work to get eyeballs on it (unless you’ve already got a huge brand like Mashable or TechCrunch, in which case you probably aren’t interested in reading this guide), so you’ll need some sort of driving mechanism to help people find it. There are generally four dimensions to consider here:
- Off-site publishers,
- Social media,
- Paid aids,
- On-site support.
The “off-site publisher” side of your strategy will focus on where and how you’ll publish content that’s off your website (such as through guest posts). Often driven by personal brands, these are guest contributions on external publications where you’ll be able to reference or cite your on-site content in a way that adds value to the content. Over time, you’ll build your way to bigger and higher authority sources, but before you jump to that level, you’ll need a plan of attack, slowly ratcheting up your efforts and targets. Social media involves sharing your content in relevant social media channels as well as through your email newsletter, and with other influencers (often via email or social media). You’ll need to figure out which social media channels are most visible or most engaging to your target market, how (and how often) to syndicate your posts, and how you’re going to grow your presence over time. Paid ads includes paid traffic avenues such as:
- Google Adwords
- Bing Ads
- Facebook Ads
- LinkedIn Ads
- StumbleUpon Ads
- Reddit Ads
- OutBrain
Paid ads can be a great way to get lots of eyeballs on your content very quickly, but it’ll come at a significant cost. In my own experience, I’ve found paid ads to be pretty disappointing in terms of engagement & shares, so I can’t really recommend them, but I’m sure there are many content marketers who have had positive experiences with them. On-site content marketing support includes internal links, navigation, notices, or ads that direct visitors on your website to a specific piece of content. For a deep dive into content distribution, see Content Unleashed: The Ultimate Guide to Promoting Your Published Content. With your vision, your goals, your customer personas, your editorial calendar, and your distribution paths solidified, you’ll have all the key components of your strategy aligned.
Launching your Content Marketing Strategy
Starting your content marketing strategy typically includes on and off-site content.
On-site Content Marketing
Your on-site content is going to serve as the backbone of your content marketing, giving you creative control, attracting inbound links (or fodder for link building services), and showcasing your value to prospective external publishers. Your editorial calendar might give you the plan of your content strategy, but don’t neglect the actual practice.
Creation, editing, and publication
There’s a ton of flexibility in how you actually create your content, since you’re in control. All that matters is that it’s eventually visible and accessible to your target audience, so the drafting process is up to you. Most people use a word processor like Microsoft Word (or Google Docs, if you’re more into team collaboration) for written content, having one person draft the material and at least one other revising and editing it. Track changes works wonderfully here.
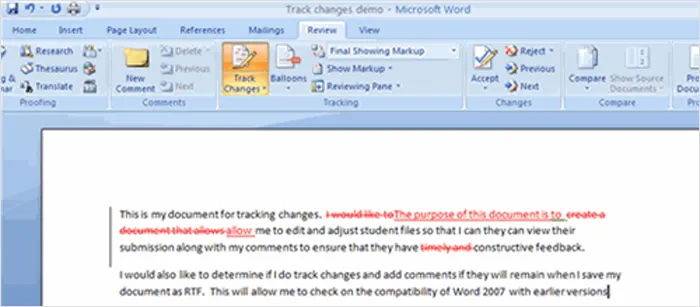
(Image Source: FGCU)
Be sure you have checks and balances in place to evaluate your content for surface-level quality ranking factors, such as detail, grammar, and syntax, but also brand-level quality factors, such as adherence to brand voice and proper formatting. Make sure your content adheres to the guidelines you established for yourself in your formal strategy. Once you’re satisfied with the finished piece, publish it to your site. For written content, this usually involves copy/pasting and filling in some additional information (including any tags and descriptions for SEO you want to include). For images, this involves a simple uploading process. For video content marketing, you can either host these yourself or publish them on YouTube and embed the finished product on a blog post.
Content marketing via promotion and syndication
The next step, of course, is to promote and syndicate that content. First, before you do anything, make sure your site (usually the blog) has social share buttons; this will make it easy for your readers to share your article socially if they found it to be engaging. This, in turn, will increase your post’s visibility, and possibly spark a chain reaction that encourages your post to go viral.
But for the most part, if you want your post to get visibility, you’ll need to share and promote it yourself. Start by sharing a link to your latest post on all your social media channels. Then, you have a few options for further promotion. For example, you could build a few links (internal or external) pointing to your piece to give it an extra boost of authority and traffic, or you could use paid ads to funnel initial traffic to it. Beyond that, you’ll want to save all your posts for future syndication (at least the evergreen pieces that will remain relevant indefinitely). What this means is, you’ll re-distribute the content on social media multiple times in the future, perhaps under a new title or lead-in, to reach people who might not have seen it the first time around.
Off-site Content Marketing
Off-site content follows many of the same rules that on-site content does. The big difference here is that you’ll have to pay attention to the needs of the individual publications with whom you work, which can add a challenging variable.
Creation, editing, and publication.
Ultimately, you’ll follow the same guidelines and procedures I outlined above, but with a few key differences. First, you’ll want to note your target publisher’s editorial requirements. They may mandate that you write posts in a specific format, or they may only accept certain types of subjects, or they may even require specific types of language to be used. Publishers can be finicky, so be sure to follow and respect their editorial guidelines. The editing process for external publishers is also going to necessitate changes in your standard workflow. Some publishers may allow you to publish to the site as if it were your own, but this is rarely the case. It’s much more common for there to be a back-and-forth editing process; you’ll send a Word document over, they’ll respond with requested changes, and you’ll eventually hammer out an acceptable piece, or you’ll submit the piece online to be subjected to their own internal editorial process. Respect your publishers, work with them, and eventually you’ll see your content featured on their site. Note that this guide doesn’t tell you exactly how to find the right publishers or make the request seem valuable to the other party to feature your content; if you’re interested in more information, be sure to check out our comprehensive beginner's guide to link building.
Content promotion and syndication
When it comes to promoting off-site content, your job is a little bit easier. You don’t have to worry about including social share icons (the publisher will do that for you), and your publisher will often promote your post on their own social networks. Still, it’s a good idea to do some promotion of your own, much in the same way you would your on-site posts. Sometimes a simple post is enough to generate an influx of traffic. Don’t neglect this step.
Building a Foundation for Content Marketing
Though your content strategy covers a number of different areas at various stages of development, it’s a good idea to think of your first job as building a foundation for your brand. Building a foundation is like shaping a wheel you plan to roll downhill; the more time you spend perfecting the shape of your wheel, the more momentum that wheel will eventually build when released. These are some of the key areas to which you’ll need to dedicate extra focus when developing your content strategy:
Blog archive
Building up an archive of blog posts is important for several reasons; before you get too excited and start self-promoting, make sure you have at least a 10 posts on your company’s blog. Not only will this help you flesh out your on-site SEO strategy, but it will also serve as a kind of resume when you start reaching out to publishers to ask for guest contributions. When publishers are evaluating your credentials, this is the first place they’re going to look, so you want to have some impressive material there for them to see. This content archive will also provide resources for new visitors to your site, making them more likely to stick around on your site longer and eventually convert.
Personal brands
You may also want to spend time shaping and developing personal brands within your organization. Select a handful of candidates you wish to promote as corporate brand ambassadors, and take note of any areas of expertise you want them to specialize in. Make a list of their previously existing credentials, have them flesh out their social media profiles, and help them understand the importance of staying in brand voice (though for personal brands, this involves their natural personality just as much as any formal brand considerations).
Social media following
For both personal brands and your corporate accounts, work on building up your following; quality is more important than quantity here, but higher numbers of more dedicated followers will be a huge boon for your content marketing efforts. It means more potential eyes on every post you publish, more social sharing opportunities, and of course, a better reputation with which to woo publishers for your guest posting campaign. You can do this simply by engaging in more discussions, reaching out to new people, and posting quality content regularly. Social media marketing is far more complicated than this, but these tactics will get you started.
Initial website publishers
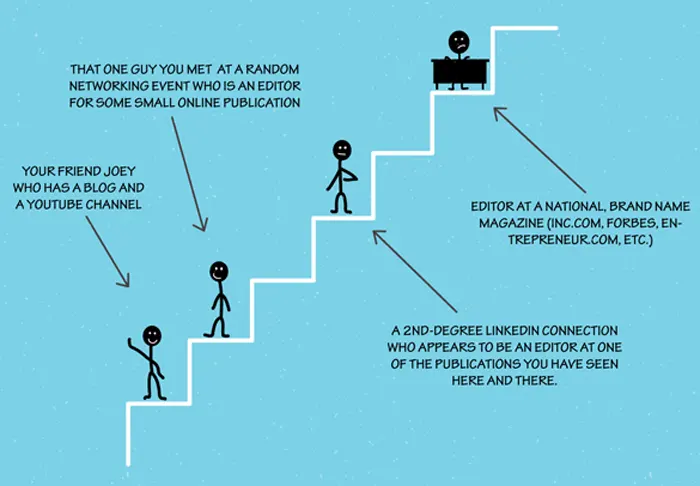
Once you have a blog archive and a decent social following, you should be able to identify and get featured on a handful of small-time publishers. Look for ones that specialize in your niche, or ones that operate locally. They’ll have less competition, though less visibility is the tradeoff. Keep in mind these are only starting points and treat these relationships the same way you would a relationship with a major publisher. Your job here is to work your way up the ladder, like this:
Scaling Your Content Marketing Campaign
Once your foundation is secure, you’ll work on scaling your content marketing upward. You may or may not have accounted for this in your original content strategy, but it’s something you’ll need to prepare for.
Start slow
Your first instinct may be to scale as fast as possible; after all, better publishers and more content marketing means more readers and more revenue, right? Unfortunately, growing too quickly (and outpacing a natural content velocity) comes with its own dangers. Your resources may be spread too thin too quickly, preventing you from producing content efficiently. You may lose your brand voice in a frantic attempt for higher visibility. You may start investing too much before you know which directions are truly effective. In any case, it’s better to scale gradually. Only take forward steps when you’re sure you’re ready to take them.
Settling into your niche
Don’t be afraid to make adjustments to your voice, your tone, your content marketing formats, and your subjects as you learn more about your niche. Hopefully, you’ve gotten significant reader feedback—in the form of comments and shares if nothing else—so you should have enough information to really find a home for your brand. You may also find yourself wanting to expand your niche, cannibalizing keywords in another niche or simply generalizing your blog for a wider audience. As you grow, this too is acceptable.
Finding better publishers
Obviously, the bigger and more recognizable the publisher, the better it will be for your content marketing; visibility, traffic, domain authority, and reputation by affiliation are just some of the benefits here. But you can’t go straight from a niche local publisher to a major national brand. Instead, you need to find “middlemen,” gradually inching your way up the authority ladder by providing content marketing examples and citing your previous publishing opportunities as evidence of your abilities.
Increasing volume
Quality must come before quantity. I’ve said it before, and I’ll say it 1,000 times more. But if you’re producing high-quality pieces, and you can keep that quality consistent, you can consider stepping up the quantity of your production in order to see better results. One good post is better than five decent posts, but five good posts is better than one good post. Don’t be afraid to escalate your volume, all other things being equal, to increase your readership and engagement.
Great Examples of Content Marketing
It’s one thing to talk about great content marketing strategies, but another to actually create one for yourself or mimics other successful content marketing examples. Here are just a few.
Microsoft Stories Content Marketing
Microsoft recently launched a segment of its campaign called Microsoft Stories, which as you can imagine, revolves around presenting stories to its readership. It's a great online content marketing example for those looking for a case study. Covering many different angles, the key elements connecting all these stories in common are narratives, as each new piece tells some kind of story, and “personal” significance. I use personal in quotes because these are stories important to “Microsoft” as a brand (theoretically; in reality, they are important to Microsoft’s actual team members). You’ll find small biographies, developments of new technologies, and other inspirational, interesting points of coverage.

(Image Source: Microsoft Stories)
This is perfect to study because it goes a counterintuitive route; rather than producing listicles and ‘how-to’ articles about technology (as a typical tech business might), Microsoft developed a content marketing strategy that truly resonates with its customers, striking an emotional connection and differentiating itself from the competition.
GoPro's Content Marketing
GoPro has an amazing YouTube channel and an Instagram account to go with it. Serving a niche industry, GoPro’s exclusive function is to produce and sell its mobile video equipment. Accordingly, the company realized that simple written content probably wouldn’t attract their key clientele: photography and videography enthusiasts. So instead, they went a more visual route, using two of the most visual-friendly platforms on the web to support their work. Furthermore, they aren’t just taking pictures and video randomly; they’re exploring the far corners of the world, going on adventures to resonate with their adventurous and mobile target market. So far, they’ve built an audience of millions, and they seem to keep growing as they create content that wows and impresses their target audience.

(Image Source: Instagram/GoPro)
Dummies' Content Marketing
If you’re over the age of 25, you likely remember the Dummies series of books as being staples for learning everything from Spanish to early-stage computer programming. They had (and admittedly, probably still have) their own sections in bookstores, and their branding became instantly recognizable. When content marketing originally made the major shift of growing into online content marketing, Dummies could have easily fallen behind, or become obsolete in the modern era. Instead, they evolved, still offering their classic book series but also adapting by making online instructional articles available to what would be their same target market in an online context. These articles, of course, are much shorter than the actual books, but they’ve helped the company maintain its authoritative reputation over the years. A reputation can take years to develop and grow but can be destroyed in a thoughtless moment. Even more interesting, Dummies has launched a new product line—a series of B2B services to help small businesses and startups find their footing in the online era of entrepreneurship and content marketing. They’ve developed a specific wing of their content marketing strategy around these demographics as well.
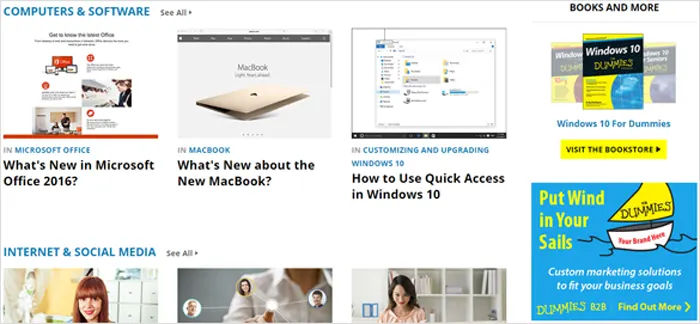
(Image Source: Dummies)
There are two powerful lessons to take away from Dummies; first, evolution is always possible. No matter how radically the game seems to change, there’s always room for you and your strategy to adapt to the new circumstances. If you don’t change, you’re going to suffer for it. Second, your content marketing strategy doesn’t have to strictly follow your business outline and goals; as you learn more about your readership, you can adjust your business to serve them even better. It creates a perfect feedback loop, allowing you to remain relevant indefinitely with your ever-increasing target audience.
Let Us Help With Your Content Marketing Strategy
Content marketing is a recursive process. Every action you take will yield a reaction, and you can use that reaction in a feedback loop to improve your next set of actions. Because of this, you need a strong start and a strong foundation; without one, those reactions and that feedback will carry no significance for your brand. There are many reasons why content marketing is critical to success for marketing your business online. We have presented here content marketing 101, a guide to showcase everything you need to know to get started with a content marketing campaign. A content marketing foundation is both the impetus for and the measurement tool of these ongoing reader reactions, so don’t underestimate its importance by attempting to improvise your content marketing strategy. Thank you for joining us for this all-in-one guide to planning and launching a content marketing strategy. Let us help you with your content marketing! Get in touch today!