How to Understand User Behavior in Google Analytics
 Samuel Edwards
Google Analytics can tell you almost anything about your site, user behaviors included. To make things simple, I want to explore the use of Google Analytics in examining user behaviour across three different, broad areas:
- User entry, how users get to your site search and where they get their first impressions.
- Behavior flow, where users go and what they do once they’re in your site.
- Engagements and conversions, how and why users engage with your brand (the ultimate measure of success).
How to Use This Guide
Before I dig any deeper, I want to clarify the intentions of this guide, some assumptions I’m making, and how to best use this guide for your own site or site search. I’m assuming a few things about your brand, which should be true regardless of any online marketing strategies you currently use:
- You have a website serving as the ultimate goal destination for your users.
- Your ultimate goal for these users is a conversion (the purchase of a product, submission of personal information, download of an app, or other form of meaningful engagement).
- Your users, regardless of whether or not they engage, also need to walk away with a positive impression so they can either return (and engage) or speak positively about your brand (enticing further engagement).
I’ll be referring to these three principles throughout the article, and will be exploring them solely in the context of user behaviour. Finding the right target audience, optimizing your traffic, maximizing your visitors, and selecting the right offers for users are all important topics for these principles, but they’ll be the subject of a future guide. For now, I’ll be focusing on the insights behavior can bring us. Feel free to read straight through or skip to a section you want specific information about.
User Entry
First, let’s take a look at how and why users are coming to your site. The place we’re going to start is where we’ll spend most of our time for this article, so get comfy.
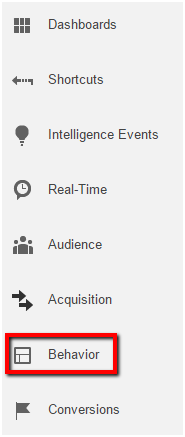
Head to “Behavior” in your dashboard and click on “Behavior Flow.” This should bring you to a massive, confusing looking chart that looks something like this:
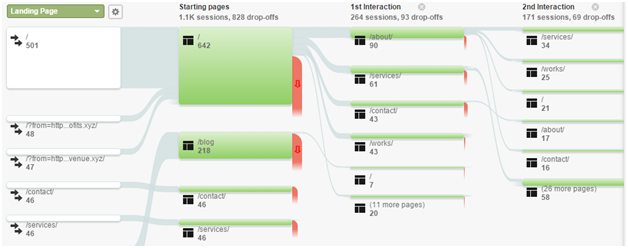
It’s about to get a lot less confusing. For now, we’re only examining how people are entering the site—we’ll get to the rest later—so take a look at the columns “landing pages” and “starting page” here. Those terms may sound synonymous, but there’s a critical semantic distinction here. A landing pages is the first URL a user clicks or enters, while a starting page is the first page a user arrives at. To illustrate the difference, consider a 301 redirect that takes a user from the URL they clicked on (a landing pages) to a final destination URL (a starting page). You may want to examine both to see how and why your users are being redirected, but remember, our focus is on behavior, so we want to ask ourselves two questions:
- What page is getting the most entrances?
- Why is it getting the most entrances?
*these questions are phrased as singular, referring to only one page, but feel free to look at several of your top-entrance pages for more thorough results. Let’s examine these individually.
What page is getting the most entrances?
For many of you, this will be a home page or a landing pages you’ve specifically created to accept new users. Either way, it’s the first page people are seeing, and this information should be enlightening to you. This is the page where the majority of your users get their first impressions of your brand. In a moment, we’ll look at how those first impressions manifest into traceable user actions, but for now ask yourself the following questions:
- Does this page accurately represent your brand? If not, then it requires improvement.
- Is there another page you’d prefer to have your users land on? If so, you’ll need to modify your acquisition strategy; otherwise, your behavior flow report may be compromised from the beginning.
- What does this page say about the intent of your users? This dips into the “why” side of the question, but think about what’s in your users’ minds as they encounter your site search for the first time. For example, a home page may indicate they’re trying to find a specific company like yours, while a specific interior page could suggest a more refined motive. You can take advantage of this by tailoring other pages to accommodate that motive.
Why is it getting the most entrances?
This question is less relevant to the behavior of your users and more relevant to your acquisition of users; this page is popular because it’s a popular page link on social media, or on a referral source, or in Google site search results. This can tell you something about the intent of your users—especially if your most popular landing pages is a specific blog page—but it speaks more to your audience targeting methods and effectiveness at online marketing in general.
Entrance modifiers
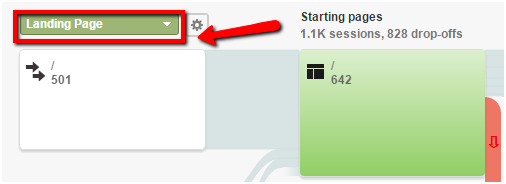
If you’re interested in gaining more insight into why and how your users are entering in these specific ways, consider adding a modifier to your behavior flow report chart. Click on the dropdown menu in the upper-left hand corner of the chart, and select a new variable to add to the left-hand side:
For illustrative purposes, select “Acquisition” and “Default Channel Grouping.” Here, you’ll see a breakdown of your major sources of traffic (Direct, Organic, Referral, and Social) and where those sources ultimately land on your site.
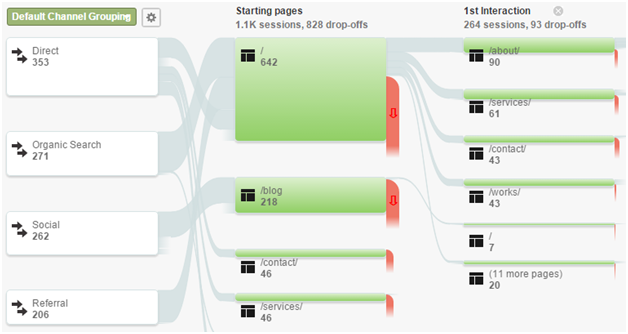
This may help you understand why certain entrance pages are more popular than others, but if you’re more interested in optimizing your initial audience, gaining more visitors, or otherwise modifying your incoming traffic, you’ll want to look at audience Acquisition rather than Behavior. For now, you should have two potential action items:
- Improve your most popular entrance pages to maximize your users’ first impressions.
- Select different entrance pages to direct your users according to your ultimate goals, and optimize them for greater user entry.
Now, let’s move on to the guts of user behavior on your site.
Behavior Flow
This will be an easy transition since I already have you looking at the Behavior Flow chart in Analytics. Now, instead of looking exclusively at the entrance page, we’re going to be examining how and why your users engage with other parts of your site. First, let’s break the chart down. There are two things to look for here:
- Directional flow. This will tell you where your users are going after their initial entry. You’ll notice several columns, starting with the “starting page” and numerically expanding to the right with “first interaction,” “second interaction,” and so on. Each new interaction represents a new web pages that a user has clicked. For example, you may see users start at your home web pages, head to your blog page, then click on a specific blog. By hovering over the graphic in question, you’ll be able to see specific numbers regarding these interactions.
- Highlighted in red will be a portion of your traffic that has left your site search altogether. Obviously, this isn’t ideal, but it’s not the end of the world, either. Take note of any abnormalities in this feature—pages with exceptionally high bounce rates, interactions levels where you lose the most users, etc.
Segmenting Your Traffic
It’s also worth noting that you can modify or add different traffic segments to evaluate certain demographics with a closer inspection. To do this, click on “Choose segment from list” above your chart, and select from any one of the dozens of choices Google offers you.
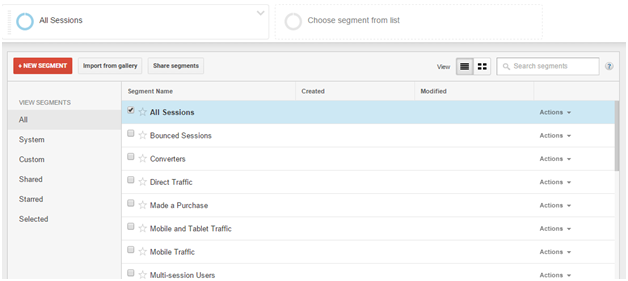
For example, you could compare the behavior of “new users” against the behavior of “returning users” and gain key insights about the differences between those familiar with your brand and those new to it.
Other Sources of Information
The Flow chart is handy and concise, but it isn’t the only place to find information about the behavior of your users. In fact, it pays to look elsewhere—check out the “Overview” section of the Behavior tab, and I’ll show you what I mean.
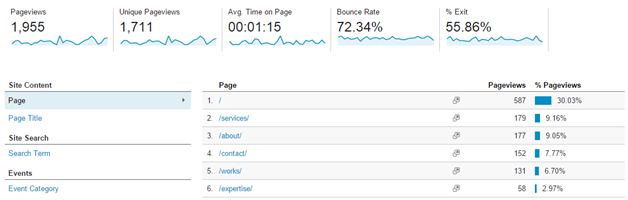
Here, you’ll find some key information about the general behavior on your site, including the average time a user spends on a page, the collective bounce rate of all your web pages, and the most popular pages of your site search overall. Click on “view full report” in the bottom right-hand corner of this chart, and you’ll be able to view metrics like these for each of your pages individually—for example, you’ll be able to calculate the average time a user spends reading a specific article on your blog or discover the bounce rate of your individual product pages. As usual with Google Analytics, there are many ways to modify this information. For starters, you can use the audience segmentation trick mentioned in the preceding section to closely examine one portion of your overall audience.
Key Insights to Look For
This is the most important piece of this section of the guide. Now that you know how to read the chart and peripheral information, it’s time to draw the key revelations that will allow you to improve your site’s design, site content, and functions.
- Which pages have the highest bounce rates? This should clue you into some small failure of these pages, though unfortunately, you’ll have to use your own judgment to pin down the exact cause. This can be a lack of relevant or interesting content, an off-putting or obtrusive feature (like an annoying popup), or even something simple like a lack of internal links. For some reason, people don’t want to venture beyond this page when they get there. It’s your job to figure out why.
- Which page connections are most significant? Take another look at your Behavior Flow chart. Are there strong correlations between any two specific pages? For example, do visitors on your homepage frequently head to your Contact page in sequence? If so, why? You can use this to your advantage in a number of different ways. For example, you could strengthen the relationship and add more conversion opportunities on the destination page, you could use similar tactics to relate two other significant pages, or you could redefine the existing page relationships to favor a different page—the choice is yours.
- How long do people spend reading your site content? This is one for the Behavior Overview page. Take a look at all your internal pages and how long users spend reading them. The higher this figure, the more engaging your site content is; a low number is a sign that your pages aren’t sufficiently developed. Learn from the pages with the highest durations; what makes these pages especially interesting, engaging, or otherwise unique? Apply these qualities to your other pages.
- How many interactions do you receive? Do you receive a lot of traffic at the “starting page” level, only to see a massive dropoff by the first interaction, followed by an almost inconsequential second interaction? That means your site needs more interactive power; try increasing the visibility and functionality of your navigation, including more internal links to other pages, and adding more calls to action throughout your site.
- Which pages see the greatest overall traffic? This is especially valuable for a site content strategy or site content reports. Look at which of your pages receive the greatest amount of traffic overall. What sets them apart? Why is it so easy for people to find them? What makes people want them in the first place? Use these insights to fuel the refinement and creation of your other pages.
With the core user behavior out of the way, let’s take a look at one final element of user behavior.
Engagements and Conversions
Any engagement with your brand is valuable, with some types being more valuable than others depending on your brand and your core strategy. “Engagement” here can mean just about anything—a download, a form submission, a purchase—and there are ways to track any of these engagements meaningfully in Analytics. To start, there are two ways to track and understand engagements: Events and Goals. Events are the most flexible creation, applicable for almost any user action on your site. Goals are better for tracing specific user paths, such as measuring visitors who most visited pages on a specific page and then convert a designated way.
Events
To start tracking Events, you need to go through a short set-up process. To avoid detracting too far from my main points, I won’t detail these steps here; they do require a bit of technical expertise, but you can find more information straight from Google on the process here. Once created, you can find reporting for all your Events under the Behavior tab in Analytics. Here, you’ll be able to filter by specific Events, groups of Events, or by different segments of your audience (detailed in my section on “Segmenting Your Traffic” above).
Goals
Goals are a bit easier to create if you’re unfamiliar with the technical side of things. First, head to the Admin section (found in the upper-right), and you’ll see three columns. Click on Goals on the furthest right-hand column.
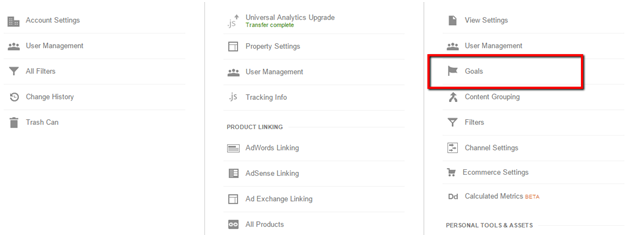
Here, Google will walk you through one of several different pre-made templates for Goal completion. Once created, you’ll be able to measure and monitor your Goals in the same location.
Learning from Goals and Events
There are tons of insights to gain from Goals and Events regarding your conversion optimization—but that’s a topic for an entirely separate post. Here, let’s examine some of the behavioral insights we can gain by looking at actions leading up to Events and Goals:
- How “deep” are users before they convert? If you notice lots of engagements around your “starting page” or “first interaction,” it means your users tend to make decisions quickly, and more conversion efforts should be spent on those introductory pages. On the other hand, you may find that your audience needs more time to make a decision, in which case your efforts should be spent getting your traffic deeper and more engaged before requesting an interaction.
- What types of pages lead to the most engagements? Hopefully, you have conversion and engagement opportunities scattered throughout your site. Invariably, some of your pages will hold more favorable engagement rates than others. Why is this? Do these pages contain more information? Are they more entertaining or more colorful? Do they show off your brand in a different way than your other pages?
- Are some engagements more lucrative than others? For example, do you get more newsletter subscribers than you get actual product purchases? This should help guide you not only in your selection and placement of engagement opportunities, but also in your presentation and arrangement of site content.
Your biggest insights here should be the motivating factors for conversion—where are users when they convert? What are they doing? What are they seeing? Where have they been? Replicate these conditions elsewhere on your site, and you’ll double your potential converting traffic. Similarly, you’ll know what to stay away from in conversion opportunities that are rarely taken by your audience.