What are Core Web Vitals & Why They Matter for SEO
 Timothy Carter
Core Web Vitals represents Google’s top three-page experience metrics. Google explains page experience as a
signal that measures aspects of how users perceive the experience of interacting with a web page
According to Google, optimizing core web vital factors
makes the web more delightful for users across all web browsers and surfaces, and helps sites evolve towards user expectations on mobile.
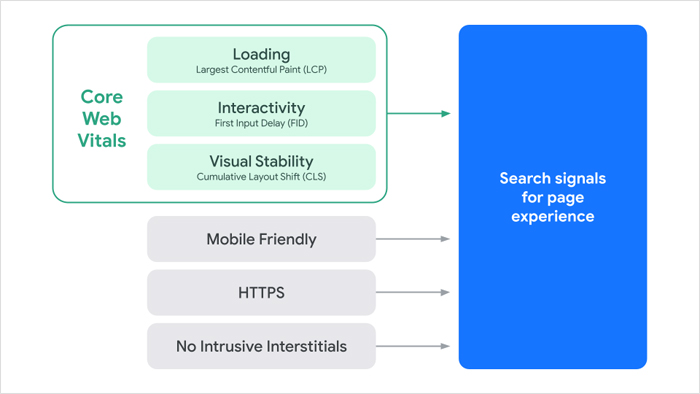
Web Vitals consist of:
- Loading: largest contentful paint
- Interactivity: first input delay
- Visual stability: visual stability cumulative layout shift (CLS)
These three factors make up part of Google’s overall page experience and measuring core web vitals metrics score. The additional factors that go into this score include:
- Mobile-friendly
- HTTPS
- No intrusive interstitials
Although some have reported that safe web browsing is a ranking factor, Google has clarified that it is not. If you’re not familiar with Page Experience, that might be because it hasn’t been a major factor for ranking. However, that’s changed. Google is officially making page experience a key ranking factor and started a gradual rollout in June 2021.
Where to find your Core Web Vitals data
Since Core Web Vitals are specific to Google, you can find your stats through Google Search Console under ‘enhancements.’ From there, you can view the mobile SEO and desktop stats that will give you an overall view of URLs that need improvement with the option to view a full report.
A detailed look at Largest Contentful Paint (LCP)
Google’s Largest Contentful Paint (LCP) metric measures perceived load speed. The faster elements appear on a web page, the more usable it is considered. More specifically, LCP measures how long it takes for the largest visible content block to render when the page is loaded. The ideal LCP score is 2.5 seconds or less. Any page with a score between 2.5 and 4 seconds needs improvement, and a score above 2.5 is considered poor. LCP is different than Google’s other page speed metrics. For example, Time To First Byte (TTFB) and First Contextual Paint (FCP) measure loading page speed that don’t necessarily affect what a user sees.
How to check your LCP score
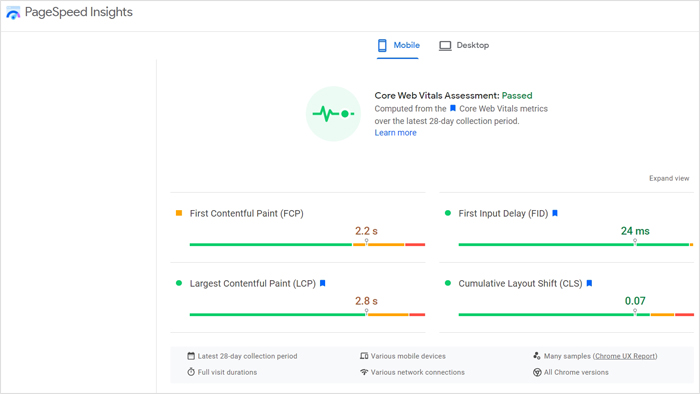
The best way to check your LCP score is through Google PageSpeed Insights. All you do is enter your URL in the text box and you’ll get the info. However, you’ll only get the data for an individual URL. To get data for your entire website, retrieve your LCP data from your Google Search Console.
How to improve your LCP score
Improving your LCP score for each of your web pages will require optimizing each page by limiting the number of high-resolution images and might require cleaning up your code. Here are several more ways to improve your LCP score:
- Eliminate unnecessary third-party scripts. If you stopped using a script, make sure you remove the code. Or, if you don’t really need a script, eliminate it from your website entirely.
- Get a faster web host. Some web hosting accounts are slow. If you’re having problems with speed in general, and it’s not on your end, get a dedicated host that offers higher speeds.
- Implement lazy loading. Lazy loading is a feature that prevents images from loading until the user scrolls down to the image. If you have, say, 100 images on one page, they won’t all load at once, which will increase your LCP score.
- Minify JavaScript and CSS. If your CSS and JavaScript is unnecessarily large, your LCP score can suffer. You can use the Minifier tool to automatically minify your code online for free.
A detailed look at First Input Delay (Fid)
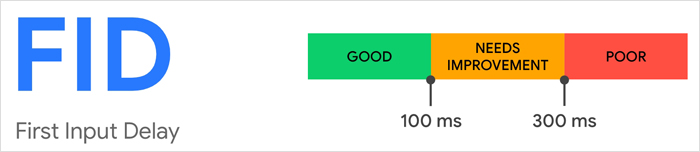
Google’s First Input Delay metric measures load responsiveness, which quantifies the experience of users interact with unresponsive pages. For example, the metric measures how long it takes for the website to process an action initiated by a user. The lower the score, the faster the response, and the more usable the page. The ideal FID score is an input delay of 100 milliseconds or less.
What does FID look like to users?
FID measures the time it takes a webpage to respond to user input for actions like:
- Selecting or highlighting an option from a menu that drops down on mouseover
- Clicking on a link
- Hitting “submit” after entering an email address in a sign-up form
- Opening a hamburger menu
Essentially, any action a user takes can be measured to calculate the FID score.
How to improve your FID score
- Minimize JavaScript. Avoid using JavaScript that isn’t absolutely necessary. If you’re using JS to create a fun, but useless feature, consider eliminating it from your site.
- Cache your content. When you deliver cached content to your users, your website will automatically load faster, including your JavaScript.
- Eliminate non-essential third-party scripts. Using heavy scripts like heatmaps and other Google analytics tools can really slow down user interaction. Consider minimizing the number of tracking and monitoring scripts you use.
A detailed look at Cumulative Layout Shift (CLS)
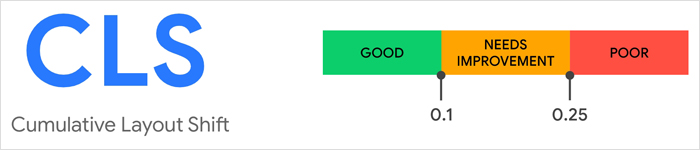
Google’s Cumulative Layout Shift metric measures how often your content shifts around for your web visitors in bursts. Layout shifts can be an extreme burden on visitors, impeding their ability to navigate your website and frustrating them in the process. The ideal CLS score is 0.1 or less. A page with a score between 0.1 and 0.25 needs improvement, while a poor score is 0.25 and above.
What does a Cumulative Layout Shift look like?
Have you ever experienced web page elements suddenly change position, appear, or disappear? These types of glitches are common, and they interfere in the user experience. For instance, a shift in layout can cause someone to click the wrong option if the shift occurs a split-second before they click. A layout shift is when a visible element starts off in one position and moves to another and are considered unstable elements. The CLS metric used to add up the total number of shifts. However, this metric now measures and records the largest burst of layout shifts. These layout glitches are usually caused by loading resources asynchronously or dynamic DOM elements that appear above static content. One element moves and shifts the position of another element. For example, third-party ads often dynamically resize on their own and sometimes videos load with unspecified dimensions.
How to improve your CLS score
- Always specify the size attribute for media like videos and images. This will tell browsers exactly how much space the element needs to use, which will prevent it from shifting and changing size while it loads.
- Confine your elements. Every element on a webpage should have a designated location. For example, avoid adding an element right underneath the <body> tag without placing it within at least one <div> tag or a table.
Why Core Web Vitals matter
Core Web Vitals measure user experience on your website. You need an easy user experience in order to rank in the search engines, generate repeat traffic, get loyal visitors, and plenty of sales. By optimizing your core web vitals, you’ll increase your chances of ranking for your keywords and generating more sales. Google already has approximately 200 ranking factors, but Core Web Vitals will likely be one of the most significant. Although a poor score will hurt your rankings, a good score won’t necessarily have an equally strong impact. That’s because a good page experience won’t overpower poor content or other subpar page elements that affect ranking.
Need help optimizing your core web vitals? We can help
Does all this sound confusing? Would you rather have someone else optimize your website for you? If so, we can help. At SEO.co, we are an expert SEO company that will analyze all of your webpages to see what your LCP, FID, and CLS scores are. If you have any low scores, we’ll analyze each page to figure out what’s causing the problem and then we’ll fix it for you. If you’re ready to get better results with these important metrics, contact us today to learn more.